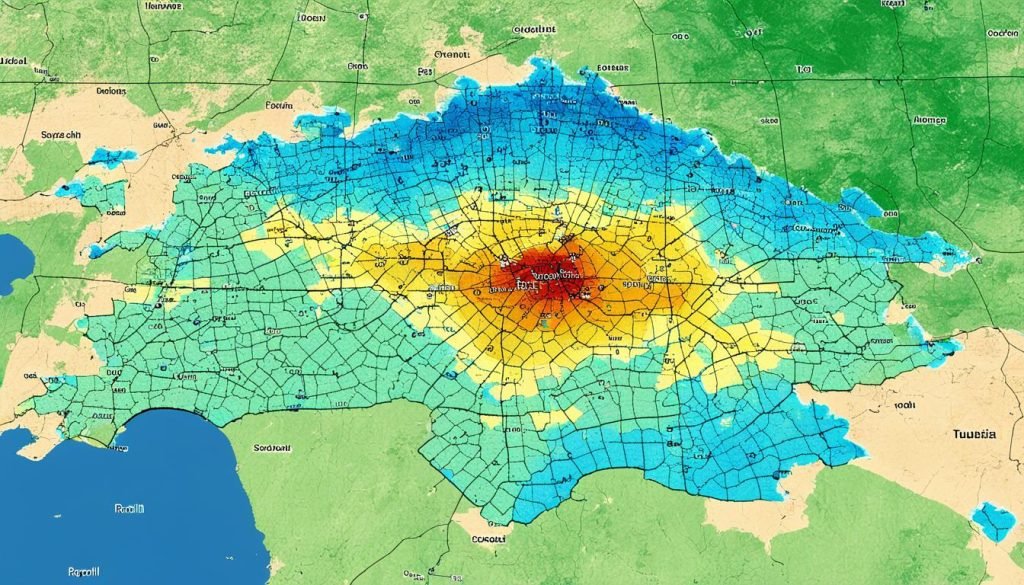
Imagine a country where one region basks in over 700 mm of rainfall annually, while another survives on less than 100 mm. This is the reality in Tunisia, where precipitation levels in Tunisia are a tale of contrasting extremes. Tunisia’s rainfall statistics startle with their diversity, marked by its northern mountains drenched in a Mediterranean climate and southern sands scorched beneath a Saharan sun. Tunisian weather patterns are as varied as the landscapes they grace, making Tunisia a land of meteorological paradoxes.
Key Takeaways
- Tunisia’s diverse topography results in varied Tunisia rainfall statistics and Tunisian weather patterns across the country.
- Precipitation levels in Tunisia show a steep decline from the wet northern mountains to the arid south.
- The capital, Tunis, experiences moderate rainfall amounting to an average of 485 mm annually.
- Geographically determined climatic variation is characteristic of Tunisian weather patterns, influencing agriculture and day-to-day life.
- Understanding the variability in rainfall is key when planning travel or agricultural activities in Tunisia.
Understanding Tunisia’s Diverse Climate Zones
As diverse as its rich culture and history, the Climate in Tunisia stretches across a gradient of weather patterns, dictated by the Mediterranean in the north to the encroaching Sahara Desert in the south. This geographical variability imparts the country with distinct climatic zones, each with unique characteristics that influence the daily lives of its inhabitants.
Northern Tunisia: Mediterranean Climate Patterns
Characterized by mild, wet winters and hot, dry summers, the Tunisian rainy season peaks in the northern areas where a Mediterranean influence prevails. The region is highlighted by cities like Bizerte, which receives an Average rainfall in Tunisia north of 650 mm annually. The capital, Tunis, experiences diverse Tunis weather conditions, with temperature averages spanning from the chill of 7.9°C in the coldest winters to the scorching 34.5°C during summer.
Transition to Aridity: Eastern Coastal Conditions

Moving southeast along the coast, the moisture received progressively wanes, aligning with the Tunisian weather patterns as one approaches the semi-arid climates. Sousse, perched on the southern Gulf of Hammamet, sees its rainfall tally at about 330 mm per year, while Sfax, further down the coast, measures a much lower annual precipitation rate of 200 mm, reflecting a clearer picture of the Tunisian semi-arid climate.
Desert Climate: The South’s Predominant Weather
Deeper into Tunisia’s southern terrain, the Sahara Desert introduces an intensely hot, and arid climate. Tozeur’s temperatures sway from a cool 6.8°C in January to a blistering 40°C in July. Rainfall is a rare commodity here, with the region receiving barely 100 mm per year. Extreme heat events in the southern desert areas can see temperatures soaring near 52°C, exemplifying the stark Climate in Tunisia.
| Region | Climate Zone | Average Temperature Range | Average Annual Rainfall (mm) |
|---|---|---|---|
| Bizerte (North) | Mediterranean | 7.9°C – 34.5°C | 650 |
| Sousse (East Coast) | Semi-Arid | 10°C – 32°C | 330 |
| Tozeur (South) | Desert | 6.8°C – 40°C | 100 |
Variability of Rainfall Across Tunisia
Tunisia, a country that boasts a variety of landscapes from its northern coast to the edge of the Sahara Desert, experiences highly variable precipitation patterns. The Tunisia rainfall statistics reflect this diversity, with the regions receiving different amounts of rainfall based on their geographical position. For instance, while the northern part of the country welcomes a moderate average rainfall in Tunisia, areas further south are subjected to the arid constraints of the desert.

The beginning of the Tunisian rainy season marks a significant change in weather patterns, particularly evident along the coast. Notably, the northern coastal regions inherit the Mediterranean influence with an annual rainfall of 485 mm. However, moving towards the interior and approaching the desert, precipitation declines dramatically, signifying a stark contrast within the country’s climactic zones.
In analyzing the Tunisian rainy season, we see that it predominantly affects the northern areas, where agricultural activities largely benefit from this seasonal water supply. Conversely, the dry desert climate puts additional stress on the water resources of the southern communities, where annual rainfall barely reaches 100 mm. This divergence in rainfall not only characterizes the country’s weather patterns but also significantly influences the lifestyle and economic activities of the regions.
The table below highlights the contrast between northern and southern Tunisia, encapsulating the wide range of Tunisia rainfall statistics:
| Region | Annual Rainfall (mm) |
|---|---|
| Northern Coast (e.g., Bizerte) | 485 |
| Southern Desert (e.g., Tozeur) | 100 |
It is evident from the provided data that the disparity in rainfall within Tunisia is pronounced. Such average rainfall in Tunisia cannot be comprehensively understood without acknowledging the regional differences that exist within the country’s borders. These contrasting patterns signify the environment’s remarkable adaptability in accommodating varied weather conditions across relatively small geographic expanses.
“Does It Rain A Lot In Tunisia?”: Analyzing Regional Precipitation Data
Exploring Tunisia rainfall statistics provides a revealing glimpse into the climatic nuances across the country. Tunis weather conditions, in particular, denote a pattern of moderate rainfall across the year with significant seasonal variation. The data regarding Precipitation levels in Tunisia demonstrates the variable nature of rainfall, influencing everything from agriculture to urban planning.
In Tunis, the capital city, the distribution of rainfall is marked by stark contrasts throughout the year. The driest period is observed in July with a meager average precipitation whereas December brings the bulk of the annual rainfall, aligning with the typical patterns of a Mediterranean climate.
For a clearer understanding of the monthly distribution, a detailed breakdown is presented below:
| Month | Average Precipitation (mm) |
|---|---|
| January | 56.9 |
| February | 47.3 |
| March | 38.4 |
| April | 35.2 |
| May | 22.7 |
| June | 9.6 |
| July | 3.1 |
| August | 5.3 |
| September | 13.4 |
| October | 23.9 |
| November | 46.5 |
| December | 66.8 |
Interestingly, with an average of 84 days of rainfall annually, Tunis shows that despite lower overall precipitation levels, the city experiences rainfall fairly frequently, albeit often in light quantities. This emphasizes the importance of considering not just totals but also the distribution and duration when assessing Tunis weather conditions.
This analysis of precipitation serves as a vital tool for various stakeholders, from policymakers to tourists, in understanding the precipitation levels in Tunisia. Comprehensive seasonal weather data is crucial in planning for water resource management, agricultural strategies, and even in the tourism industry for setting expectations for travelers.
Trend Analysis: Changes in Temperature and Rainfall Over Time
Investigating the Climate in Tunisia offers insights into the dynamics of its environmental landscape. An understanding of historic and current Tunisian weather patterns is vital to assessing the impact of climate change on the region. This section delves into the long-term shifts observed in temperature averages and recent variations in precipitation, providing a holistic view of the climate’s progression.
Historical Shifts in Temperature Averages
In the span of a recent three-decade period, notable increments in Tunisia’s temperature have been recorded. Scientific assessments point to an average increase of 0.4°C every ten years, accumulating to a notable rise of approximately 1.4°C by the end of the last century. Such trends highlight a concerning progression towards intensifying warmer conditions countrywide, implicating Average rainfall in Tunisia and overall Tunisian weather patterns.
Long-Term Patterns and Recent Variations in Precipitation
From the beginning of the 20th century to the early 21st century, Tunisia did not witness drastic changes in its aggregated annual precipitation. Nevertheless, a subtle yet consistent annual decrease in Precipitation levels in Tunisia by 3% has become apparent over the past few decades. Seasonal analysis reveals a surge in autumn rainfall within Tunisia’s northern and central territories, a trend juxtaposing the lesser precipitation rates in other regions.
| Decade | Average Temperature Increase (°C) | Annual Precipitation Change (%) | Autumn Precipitation Trend |
|---|---|---|---|
| 1980-1990 | 0.4 | -3.0 | Upturn in north & central |
| 1990-2000 | 0.4 | -2.5 | Stable in north, decline in south |
| 2000-2010 | 0.4 | -3.5 | Increase in central, stable in south |
| 2010-2020 | 0.4 | -3.2 | Significant upturn in northern regions |
The tabulated data evidences how the Climate in Tunisia is undergoing a period of change, subtle yet potentially significant in the long-term. A keen eye on such trends and their potential impacts is crucial for the country’s agriculture, water management, and overall sustainability strategies.
Conclusion
In summary, the Climate in Tunisia showcases a distinct dichotomy, where regional interplays between geography and climate culminate in diverse weather experiences across the country. Focusing on the Tunisia rainfall statistics, a clear pattern emerges of moderate to low precipitation levels, thus dispelling perceptions that Tunisia is a country characterized by abundant rainfall. Predominantly, the northern areas enjoy a Mediterranean climate with relatively higher rainfall statistics, starkly contrasting the southern regions where arid and desert conditions prevail.
With an astute and ongoing observation of Tunisian weather patterns, it is evident that while the nation is becoming progressively warmer, the shifts in precipitation remain subtle rather than severe in their long-term impact. This nuanced understanding is critical for agriculture, urban planning, and managing water resources in Tunisia. It also serves as a reference for travelers and the curious minds looking to explore the dynamic and diverse climates of this North African landscape.
As the world’s climate continues to evolve, keeping abreast of changing weather patterns in places like Tunisia helps better comprehend the broader implications of these trends on global ecology and society. The tale of Tunisia’s weather speaks volumes about the vitality of acknowledging and adapting to our planet’s shifting climatic rhythms.


